


QC SPC Chart Free Version
คำอธิบายของQC SPC Chart Free Version
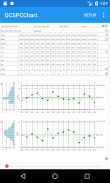
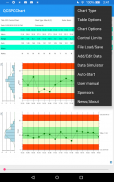
The QC SPC Chart software is an interactive SPC chart (6-sigma) application aimed at quality control professionals (and students) who want to view industry standard statistical quality control charts on their mobile devices. Typical users will monitor critical quality factors in manufacturing, process, and service industries, and display the results in one of the many supported chart types. Chart types include: variable control charts (XBar-R, XBar-Sigma, Individual-Range, and Median-Range), and attribute control charts for monitoring defects (p-, np-, c-, u-, and DPMO charts). The software will automatically calculate SPC control limits using historical data for the supported variable control chart and attribute control chart types. Alarms can be generated for standard +3 sigma control limits, or the WECO (Western Electric) rules. It will also calculate process capability ratios (Cp, Cpk) and process performance indices (Pp, Ppk). A set of specification limits can also be added to the chart.
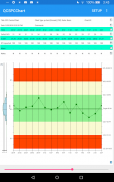
The SPC charts are displayed as one or two synchronized charts, under the control of a scroll bar. The scroll bar can be replaced by an integrated zoom control which allows for the display of charts with a custom time frame. Auto-scaling of the charts y-axes keeps everything in view. An integrated table appears above the chart, that displays information about the process under view, and each sample interval plotted in the chart. The table displays time, individual sample values, sample statistics, process indices, alarm status, and any notes entered for that sample interval.
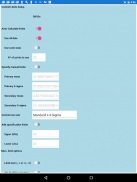
The user can customize the SPC chart and control limits using built-in setup forms. Both auto-calculated and manually set control limits are supported. The user can manually input and edit sample data from within the program. The user can also import sample data from a CSV (comma separated value) file. The entire chart setup, and data, can be saved on the host device so that they are easily accessible the next time you use the app. You can even set the current setup to be auto-loaded the next time the app starts.
The software displays a lot of information on the screen at once, and it is recommended that it be used on devices with a minimum of 1200x800 pixel resolution, landscape or portrait mode.
This app is the free version of the software and the total number of sample intervals (data points) which can be displayed at one time is limited to 100.
ซอฟแวร์ QC SPC แผนภูมิเป็นแผนภูมิ SPC โต้ตอบ (6 ซิก) แอพลิเคชันมุ่งเป้าไปที่ผู้เชี่ยวชาญด้านการควบคุมคุณภาพ (และนักเรียน) ที่ต้องการเพื่อดูมาตรฐานแผนภูมิควบคุมคุณภาพทางสถิติอุตสาหกรรมบนโทรศัพท์มือถือของพวกเขา ผู้ใช้ทั่วไปจะตรวจสอบปัจจัยที่มีคุณภาพที่สำคัญในอุตสาหกรรมการผลิตกระบวนการและการบริการและการแสดงผลลัพธ์ในหนึ่งในการสนับสนุนหลายประเภทแผนภูมิ ประเภทแผนภูมิรวมถึง: แผนภูมิควบคุมตัวแปร (Xbar-R Xbar-Sigma, บุคคลช่วงและค่ามัธยฐานช่วง) และแอตทริบิวต์แผนภูมิควบคุมสำหรับการตรวจสอบข้อบกพร่อง (p-, NP-, C-, ยูและแผนภูมิ DPMO) . ซอฟแวร์จะคำนวณโดยอัตโนมัติ SPC ข้อ จำกัด การควบคุมการใช้ข้อมูลทางประวัติศาสตร์สำหรับแผนภูมิควบคุมตัวแปรการสนับสนุนและแอตทริบิวต์การควบคุมชนิดแผนภูมิ สัญญาณเตือนภัยสามารถสร้างมาตรฐาน 3 ข้อ จำกัด การควบคุมซิกหรือ WECO (เวสเทิร์ไฟฟ้า) กฎ นอกจากนี้ยังจะคำนวณอัตราส่วนความสามารถของกระบวนการ (Cp, Cpk) และดัชนีสมรรถนะของกระบวนการ (PP, Ppk) ชุดของข้อ จำกัด ที่ระบุนอกจากนี้ยังสามารถเพิ่มเข้าไปในแผนภูมิ
แผนภูมิ SPC จะแสดงเป็นหนึ่งหรือสองแผนภูมิตรงกันภายใต้การควบคุมของแถบเลื่อนที่ แถบเลื่อนจะถูกแทนที่โดยควบคุมการซูมแบบบูรณาการซึ่งจะช่วยให้การแสดงผลของแผนภูมิที่มีกรอบเวลาที่กำหนดเอง Auto-ไต่ชาร์ต Y-แกนช่วยให้ทุกอย่างในมุมมอง ตารางรวมปรากฏเหนือแผนภูมิที่แสดงข้อมูลเกี่ยวกับกระบวนการภายใต้การดูและแต่ละช่วงเวลาตัวอย่างลงจุดในแผนภูมิ ตารางแสดงเวลา, ค่าตัวอย่างแต่ละตัวอย่างสถิติดัชนีกระบวนการสถานะการเตือนภัยและการบันทึกใด ๆ ที่ป้อนสำหรับช่วงเวลาตัวอย่างที่
ผู้ใช้สามารถปรับแต่ง SPC แผนภูมิและการควบคุมข้อ จำกัด ที่ใช้ในตัวรูปแบบการติดตั้ง ทั้งรถยนต์คำนวณและการควบคุมการตั้งค่าด้วยตนเองขีด จำกัด ได้รับการสนับสนุน ผู้ใช้สามารถป้อนข้อมูลด้วยตนเองและแก้ไขตัวอย่างข้อมูลจากภายในโปรแกรม ผู้ใช้ยังสามารถนำเข้าข้อมูลตัวอย่างจากไฟล์ (คั่นด้วยเครื่องหมายจุลภาคค่า) CSV การตั้งค่าแผนภูมิทั้งหมดและข้อมูลจะถูกบันทึกไว้บนอุปกรณ์โฮสต์เพื่อให้พวกเขาสามารถเข้าถึงได้ง่ายในครั้งต่อไปที่คุณใช้แอป คุณยังสามารถตั้งค่าการตั้งค่าปัจจุบันจะถูกโหลดอัตโนมัติครั้งต่อไปที่แอปเริ่มต้น
ซอฟแวร์จะแสดงข้อมูลบนหน้าจอในครั้งเดียวและก็จะแนะนำว่ามันถูกนำมาใช้บนอุปกรณ์ที่มีความละเอียดต่ำสุดของ 1200x800 พิกเซลโหมดแนวนอนหรือแนวตั้ง
app นี้เป็นรุ่นฟรีของซอฟต์แวร์และจำนวนรวมของช่วงเวลาที่กลุ่มตัวอย่าง (จุดข้อมูล) ซึ่งสามารถแสดงได้ในครั้งเดียวจะ จำกัด อยู่ที่ 100
QC SPC Chart Free Version--เวอร์ชั่นAug 2021
(09-08-2021)QC SPC Chart Free Version - ข้อมูล APK
เวอร์ชั่น APK: Aug 2021แพ็คเกจ: com.quinncurtis.spcchart_free_versionเวอร์ชั่นล่าสุดของQC SPC Chart Free Version
เวอร์ชั่นอื่น


แอปในประเภทเดียวกัน